学习csv
2024-08-31 01:59:13
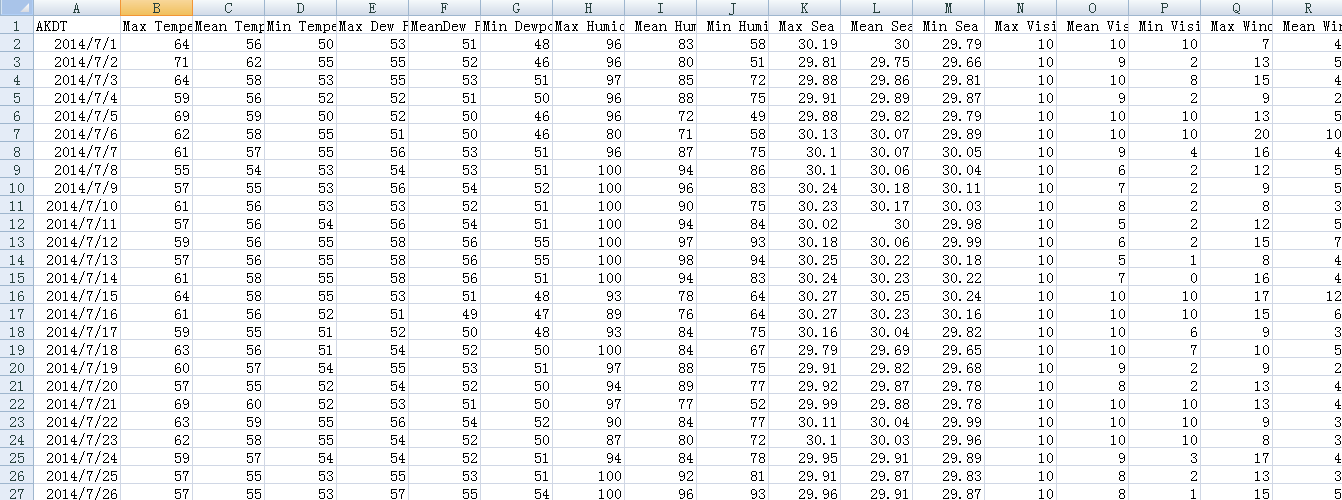
1.csv文件读取,csv文件是常用的数据存储格式之一,我们使用Python模块来处理csv文件,这是一个天气信息表
import csv
from matplotlib import pyplot as plt filename = 'sitka_weather_07-2014.csv'
with open(filename) as f:
#从文件获取数据
reader = csv.reader(f)
#获取数据的第一行也就是数据字段
header_row = next(reader)
#print(header_row)
#遍历读取到的第一行数据使用enumerate函数来获取每个元素的索引和值
# for index ,column_header in enumerate(header_row):
# print(index,column_header) highs=[]
#从文件获取到最高气温
for row in reader:
highs.append(int(row[1]))
print(highs)
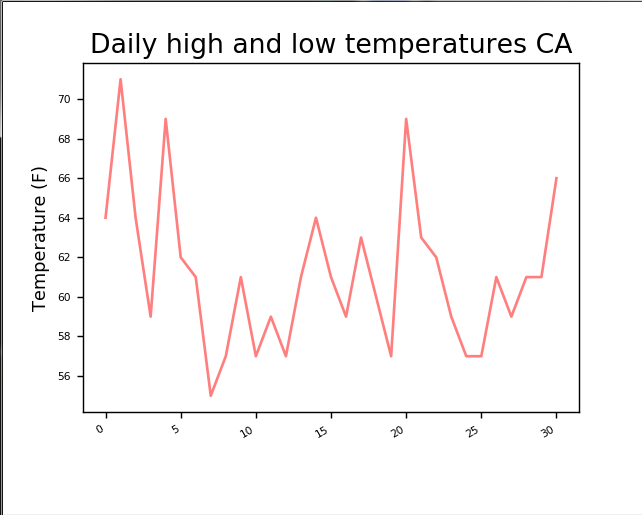
fig = plt.figure(dpi=128, figsize=(10, 6))
plt.plot(highs, c='red', alpha=0.5)
#plt.plot(dates, lows, c='blue', alpha=0.5)
#plt.fill_between(dates, highs, lows, facecolor='blue', alpha=0.1) title = "Daily high and low temperatures CA"
plt.title(title, fontsize=20)
plt.xlabel('', fontsize=16)
fig.autofmt_xdate()
plt.ylabel("Temperature (F)", fontsize=16)
plt.tick_params(axis='both', which='major', labelsize=16) plt.show()
除了这样显示,我们还可以读取时间数据显示在x轴上,添加datetime模块
from datetime import datetime
读取时间数据
filename = 'sitka_weather_07-2014.csv'

with open(filename) as f:

    #从文件获取数据

    reader = csv.reader(f)

    #获取数据的第一行也就是数据字段

    header_row = next(reader)

    #print(header_row)

    #遍历读取到的第一行数据使用enumerate函数来获取每个元素的索引和值

    # for index ,column_header in enumerate(header_row):

    #     print(index,column_header)

    highs,dates=[],[]

    #从文件获取到最高气温

    for row in reader:

        #从文件获取日期

        current_date=datetime.strptime(row[0],"%Y-%m-%d")

        dates.append(current_date)

        highs.append(int(row[1]))

    print(highs,dates)

    fig = plt.figure(dpi=128, figsize=(5, 4))

    #添加日期

    plt.plot(dates,highs, c='red', alpha=0.5)
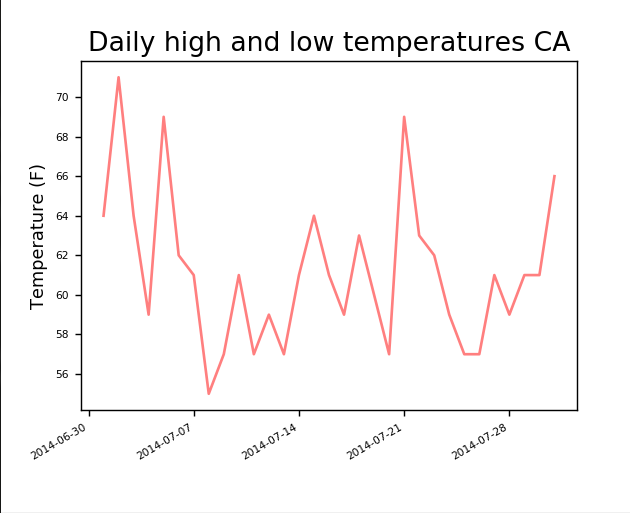
图中是一个月的天气温度情况
当然还可以读取整年的天气情况,只要有足够的数据
2.绘制一个数据系列,对比全年每个月的最高气温和最低气温
import csv

from datetime import datetime

from matplotlib import pyplot as plt

filename = 'death_valley_2014.csv'

with open(filename) as f:

    reader = csv.reader(f)

    header_row = next(reader)

    dates, highs, lows = [], [], []

    for row in reader:

        #判断是否有时间信息

        try:

            current_date = datetime.strptime(row[0], "%Y-%m-%d")

            high = int(row[1])

            #读取最低温数据

            low = int(row[3])

        except ValueError:

            print(current_date, 'missing data')

        else:

            dates.append(current_date)

            highs.append(high)

            lows.append(low)

#绘制图表.

fig = plt.figure(dpi=128, figsize=(10, 9))

plt.plot(dates, highs, c='red', alpha=0.5)

plt.plot(dates, lows, c='blue', alpha=0.5)

#facecolor指定了填充区域的颜色

plt.fill_between(dates, highs, lows, facecolor='blue', alpha=0.1)

title = "Daily high and low temperatures  CA"

plt.title(title, fontsize=10)

plt.xlabel('', fontsize=6)

fig.autofmt_xdate()

plt.ylabel("Temperature (F)", fontsize=6)

plt.tick_params(axis='both', which='major', labelsize=6)

plt.show()

最新文章
- 公司培训 oracle( 第一天)
- 手把手教你用python打造网易公开课视频下载软件3-对抓取的数据进行处理
- jQuery Easy UI 开发笔记
- [Effective JavaScript 笔记]第43条:使用Object的直接实例构造轻量级的字典
- python实现查找指定文件
- props验证
- Ubuntu之网络配置
- Java基础知识强化之IO流笔记24:FileInputStream / FileOutputStream 复制文本文件案例2
- jx3dps开发日记
- Delphi Ini 操作简单例子
- 使用virsh搭建虚拟机管理环境
- CSS常见布局解决方案
- 每日一练之排序算法(P1097 统计数字)
- conda install 出错
- Python—元类
- Python3-协程
- 并发编程之 SynchronousQueue 核心源码分析
- [转]Magento2命令行配置之性能测试生成数据
- python 遇到的一些坑
- Centos6.4下安装mysql5.6.10
热门文章
- 生成sde
- 如何使用PHP显示在线Word文档
- 分布式软件体系结构风格(C/S,B/S)
- Android 完全退出应用程序
- Codesys——PLCopen基本运动控制功能块的使用方法总结
- RxJava使用介绍
- python 循环高级用法 [expression for x in X [if condition] for y in Y [if condition] ... for n in N [if condition] ]按照从左至右的顺序,分别是外层循环到内层循环
- 使用EL表达式正确情况下报错:javax.servlet.jsp cannot be resolved to a type
- js获取request参数值(javascript 获取request参数值的方法)
- linux命令 - free -m