Hadoop生态圈-使用Ganglia监控flume中间件
Hadoop生态圈-使用Ganglia监控flume中间件
作者:尹正杰
版权声明:原创作品,谢绝转载!否则将追究法律责任。
一.Ganglia监控简介
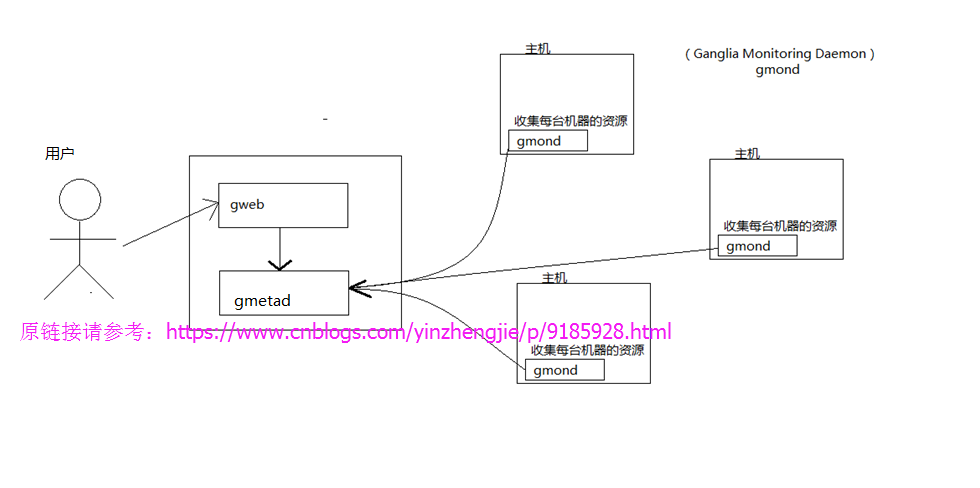
加州伯克利大学千禧计划的其中一个开源项目.是一个集群汇总监控用的的软件,和Cacti不同,cacti是详细监控集群中每台服务器的运行状态,而Ganglia是将集群中的服务器数据进行汇总然后监控。有时通过cacti或者zabbix看不出来的集群总体负载问题,却能够在Ganglia中体现。被监控的主机(即client)安装ganglia-gmond并启动该进程。服务器端需要安装gmetad和web程序。大致大构图如下:
二.部署Ganglia监控软件
1>.安装依赖包
[root@yinzhengjie ~]# yum -y install rrdtool perl-rrdtool rrdtool-devel apr-devel
[root@yinzhengjie ~]# yum -y install httpd php
3>.升级yum源
[root@yinzhengjie ~]# rpm -Uvh http://dl.fedoraproject.org/pub/epel/6/x86_64/epel-release-6-8.noarch.rpm
[root@yinzhengjie ~]# yum -y install ganglia-gmetad ganglia-web ganglia-gmond
5>.编辑gmetad.conf配置文件
[root@yinzhengjie ~]# more /etc/ganglia/gmetad.conf | grep data_source | grep -v ^#

data_source "flume120.aggrx"  10.1.2.120

[root@yinzhengjie ~]#
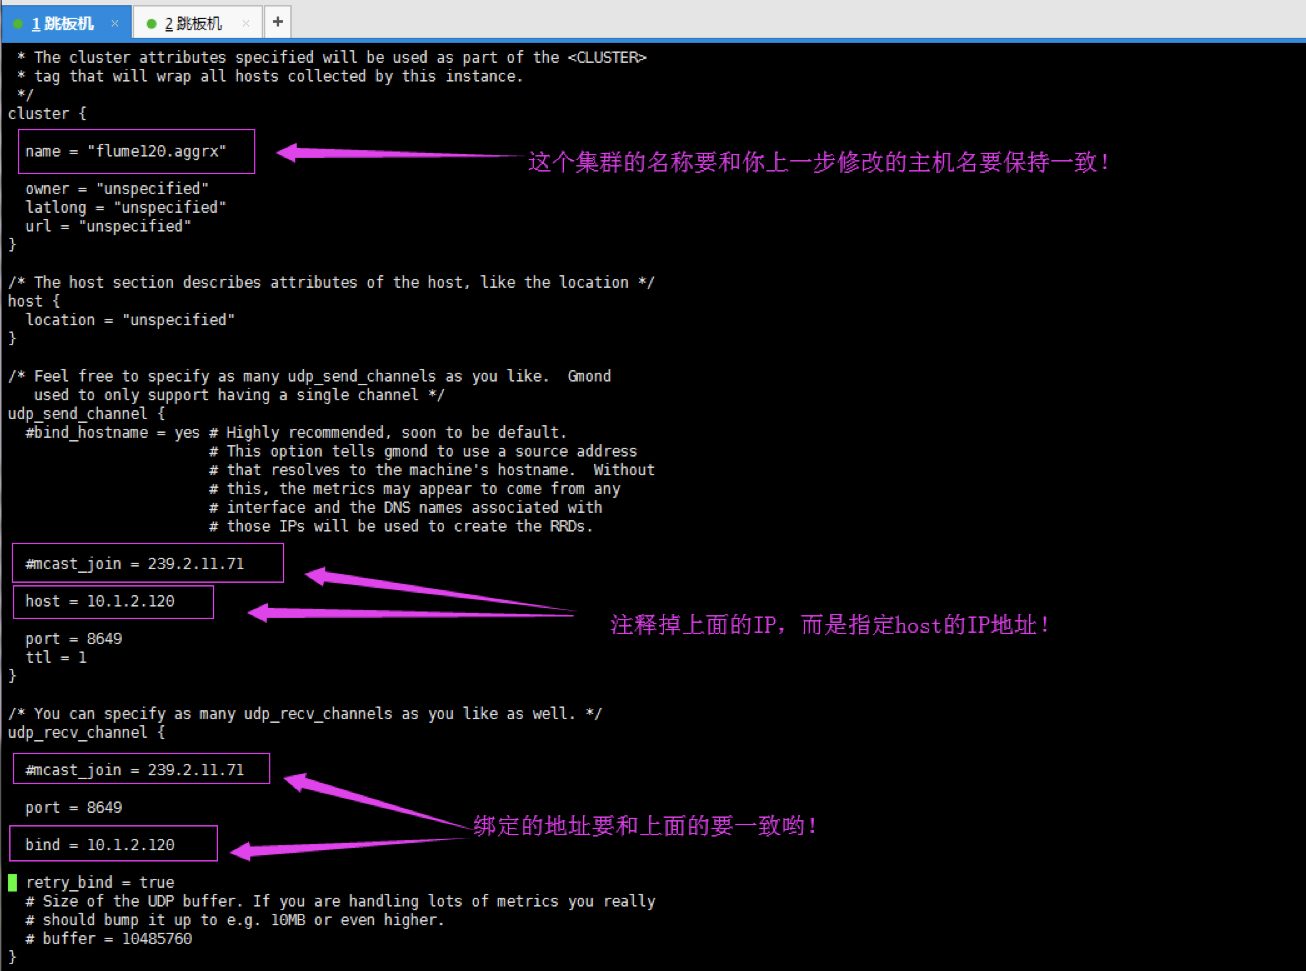
6>.编辑 /etc/ganglia/gmond.conf配置文件,具体修改如下图所示。
7>.关闭防火墙和selinux
[root@yinzhengjie ~]# systemctl stop firewalld

[root@yinzhengjie ~]# systemctl disable firewalld

Removed symlink /etc/systemd/system/multi-user.target.wants/firewalld.service.

Removed symlink /etc/systemd/system/dbus-org.fedoraproject.FirewallD1.service.

[root@yinzhengjie ~]#

[root@yinzhengjie ~]# sed -i 's#SELINUX=enforcing#SELINUX=disabled#' /etc/selinux/config

[root@yinzhengjie ~]#

[root@yinzhengjie ~]# cat /etc/selinux/config | grep SELINUX= | grep -v ^#

SELINUX=disabled

[root@yinzhengjie ~]#

[root@yinzhengjie ~]# getenforce

Disabled

[root@yinzhengjie ~]#

[root@yinzhengjie ~]#
8>.启动ganglia
[root@yinzhengjie ~]# systemctl start httpd

[root@yinzhengjie ~]#

[root@yinzhengjie ~]# systemctl enable httpd

Created symlink from /etc/systemd/system/multi-user.target.wants/httpd.service to /usr/lib/systemd/system/httpd.service.

[root@yinzhengjie ~]#

[root@yinzhengjie ~]#

[root@yinzhengjie ~]# systemctl start gmetad

[root@yinzhengjie ~]#

[root@yinzhengjie ~]# systemctl enable gmetad

Created symlink from /etc/systemd/system/multi-user.target.wants/gmetad.service to /usr/lib/systemd/system/gmetad.service.

[root@yinzhengjie ~]#

[root@yinzhengjie ~]#

[root@yinzhengjie ~]# systemctl start gmond

[root@yinzhengjie ~]#

[root@yinzhengjie ~]# systemctl enable gmond

Created symlink from /etc/systemd/system/multi-user.target.wants/gmond.service to /usr/lib/systemd/system/gmond.service.

[root@yinzhengjie ~]#
9>.创建ganglia的web UI目录的软连接
[root@yinzhengjie ~]# ln -s /usr/share/ganglia/ /var/www/html/ganglia

[root@yinzhengjie ~]#

[root@yinzhengjie ~]# ll /var/www/html/

total

lrwxrwxrwx  root root  Oct  : ganglia -> /usr/share/ganglia/

[root@yinzhengjie ~]#
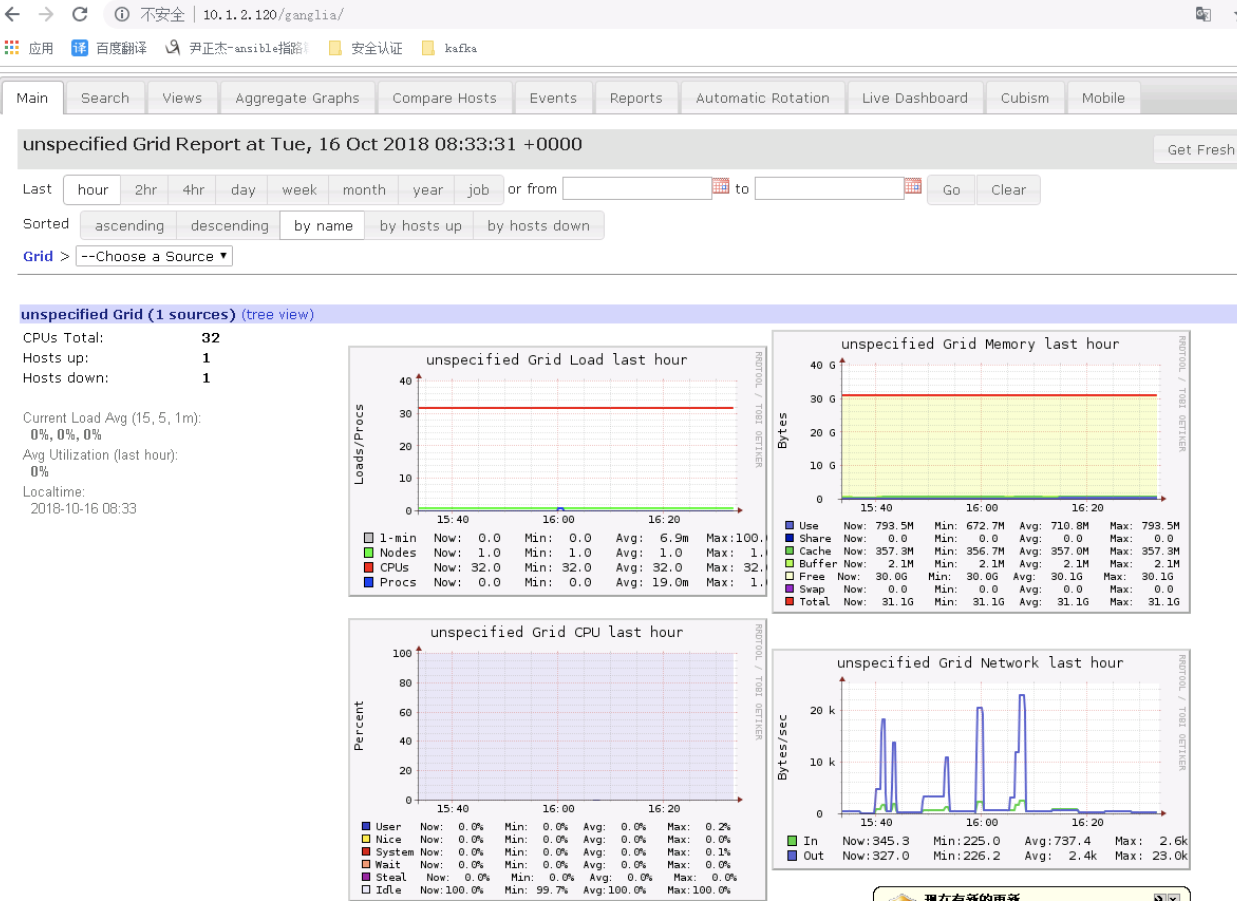
10>.登陆webUI(如果能看到下图就OK啦!)
关于部署Ganglia集群监控的文章,给出以下两个链接:
推荐一:https://www.cnblogs.com/yinzhengjie/p/9185928.html(亲测好使)
推荐二:https://github.com/ganglia/monitor-core/wiki/Ganglia-Quick-Start
三.使用Ganglia监控flume(注意,flume-agent端的节点可以不和Ganglia不是同一台机器哟!)
1>.编写flume的配置文件
[root@node106 ~]# cat /yinzhengjie/data/flume/job/flume-telnet.conf

# 这里的“yinzhengjie”是agent的名称,它是我们自定义的。我们分别给“yinzhengjie”的sources,sinks,channels的别名分别为r1,k1和c1。

yinzhengjie.sources = r1

yinzhengjie.sinks = k1

yinzhengjie.channels = c1

# 指定source的类型为netcat(source的type有很多,咱们不用记住它,需要用的时候去官网查就好),绑定source的主机是“node106.yinzhengjie.org.cn”,绑

定的端口为“”

yinzhengjie.sources.r1.type = netcat

yinzhengjie.sources.r1.bind = node106.yinzhengjie.org.cn

yinzhengjie.sources.r1.port =

# 指定sink的类型,我们这里指定的为logger,即控制台输出。

yinzhengjie.sinks.k1.type = logger

# 指定channel的类型为memory,指定channel的容量是1000,每次传输的容量是100

yinzhengjie.channels.c1.type = memory

yinzhengjie.channels.c1.capacity =

yinzhengjie.channels.c1.transactionCapacity =

# 绑定source和sink

yinzhengjie.sources.r1.channels = c1

yinzhengjie.sinks.k1.channel = c1

[root@node106 ~]#
2>.启用flume自己的监控工具,可以通过webUI去查看相应的信息( -Dflume.monitoring.type=http -Dflume.monitoring.port=5200)
[root@node106 conf]# flume-ng agent --conf /yinzhengjie/data/flume/ --name yinzhengjie --conf-file /yinzhengjie/data/flume/job/flume-telnet.conf -Dflume.monitoring.type=http -Dflume.monitoring.port= -Dflume.root.logger==INFO,console
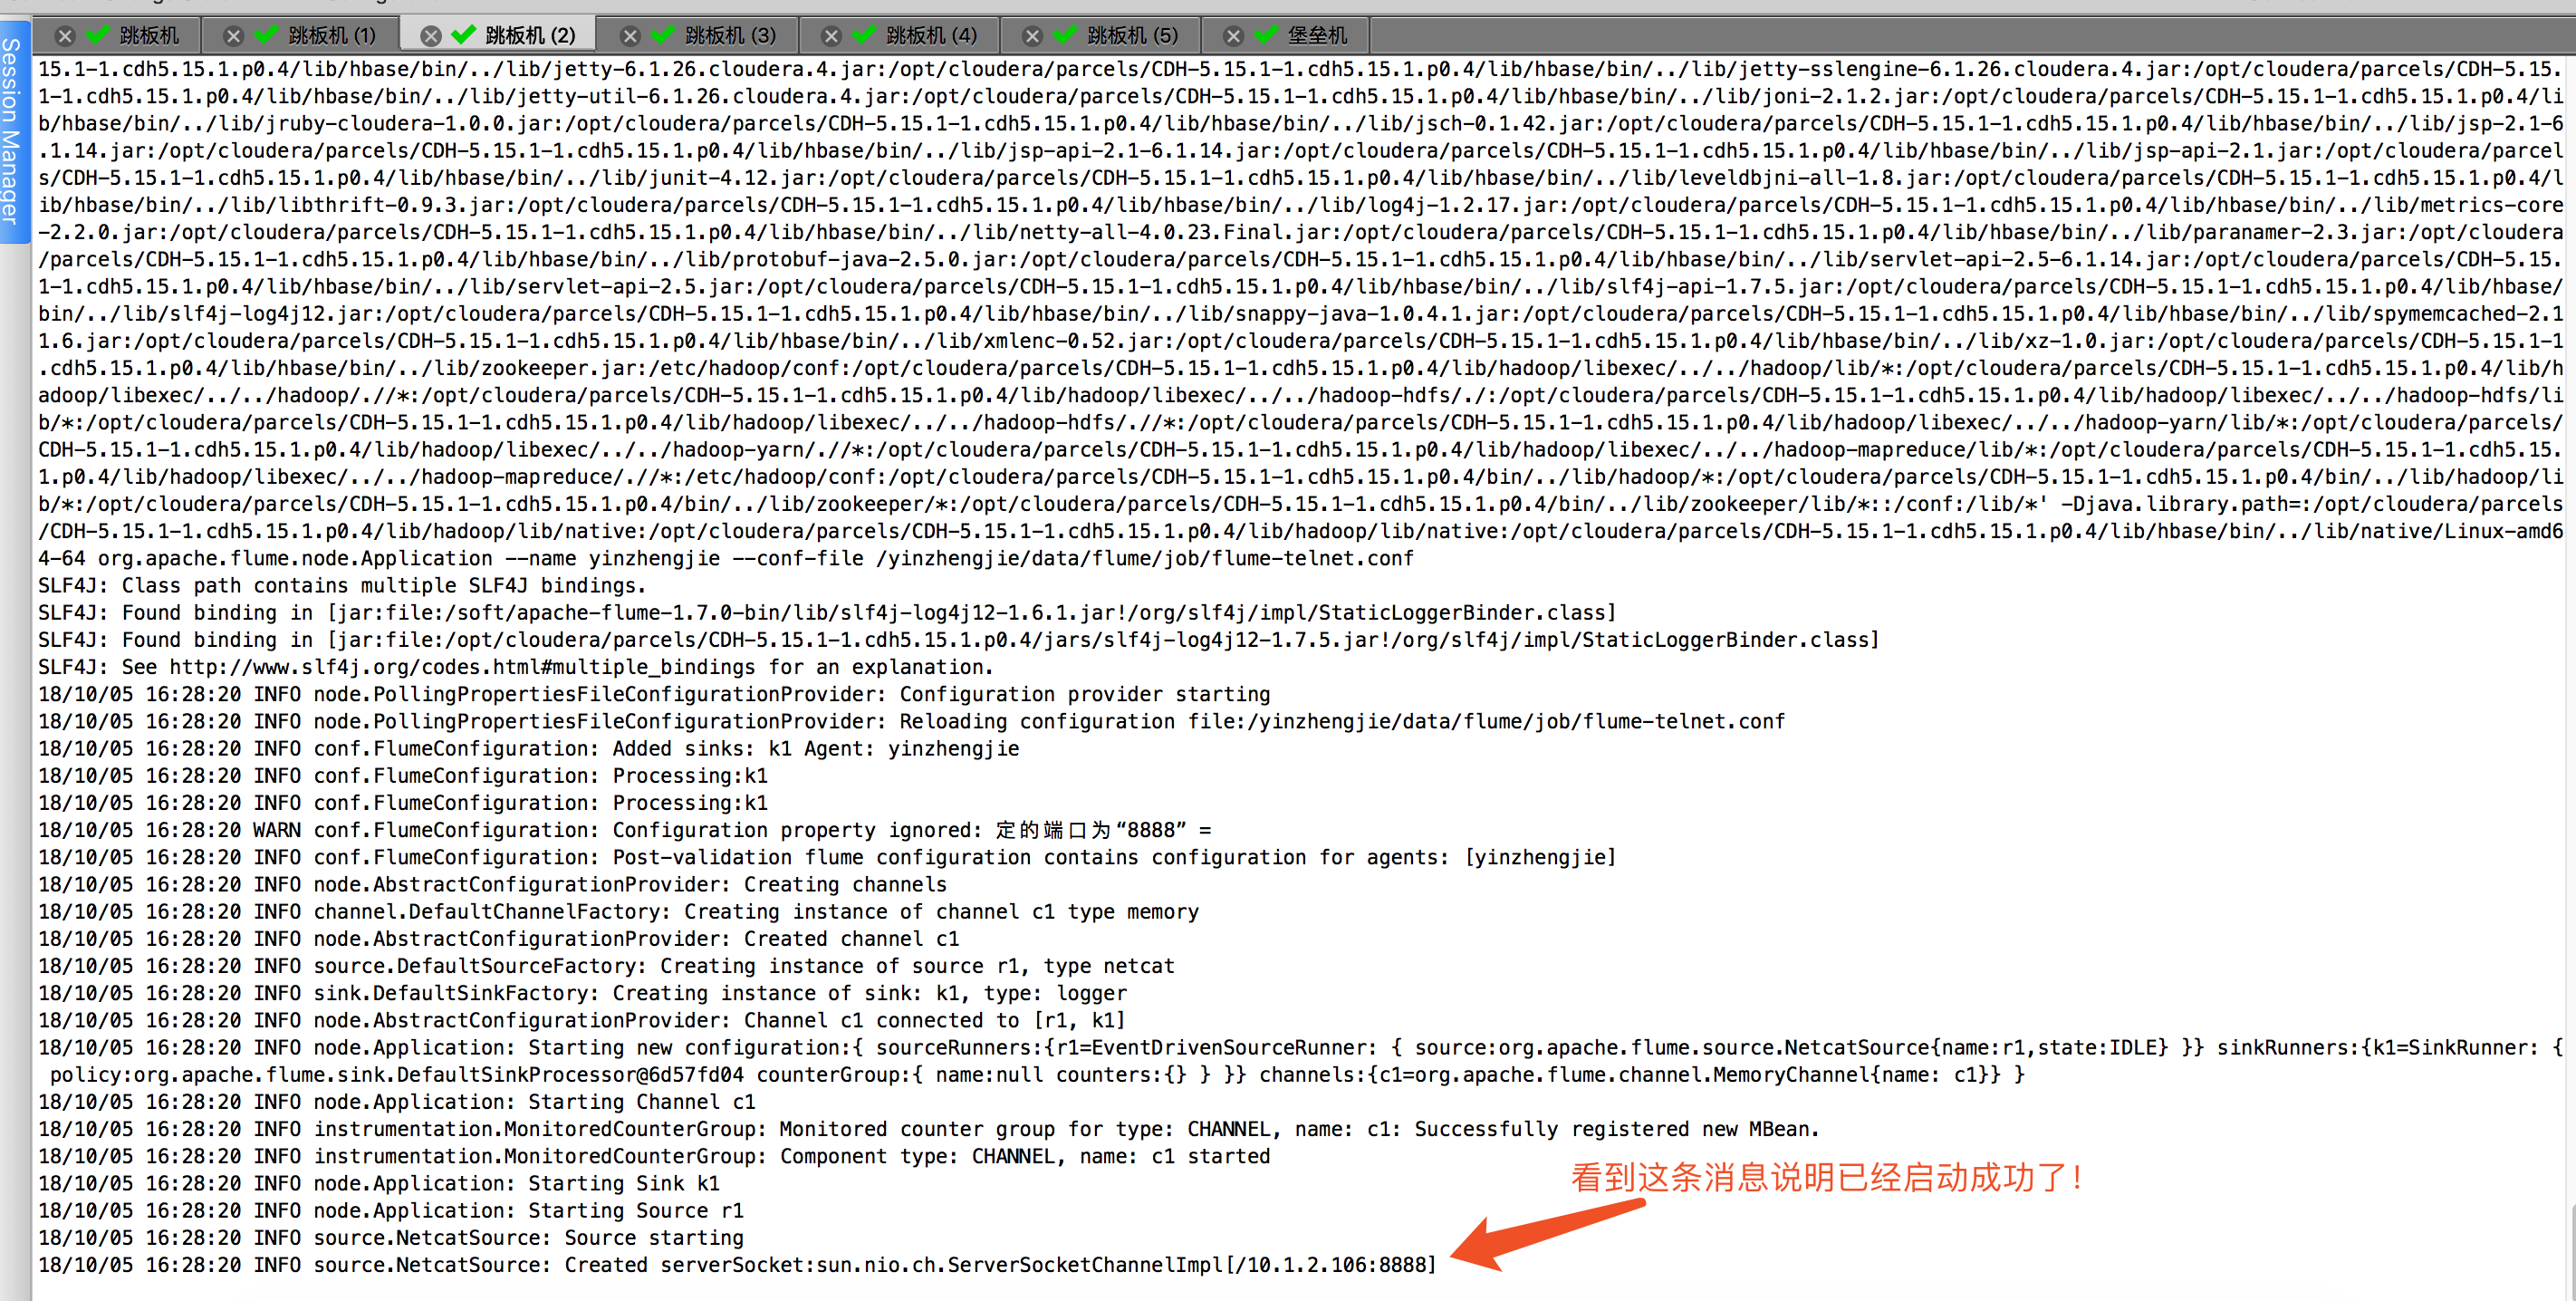
注意:上面指定的端口是指本机的端口,如何其它机器想要查看flume的各个组件的信息,可以指定当前的IP地址和端口好进行查看。启动成功会有如下图所示的提示信息:
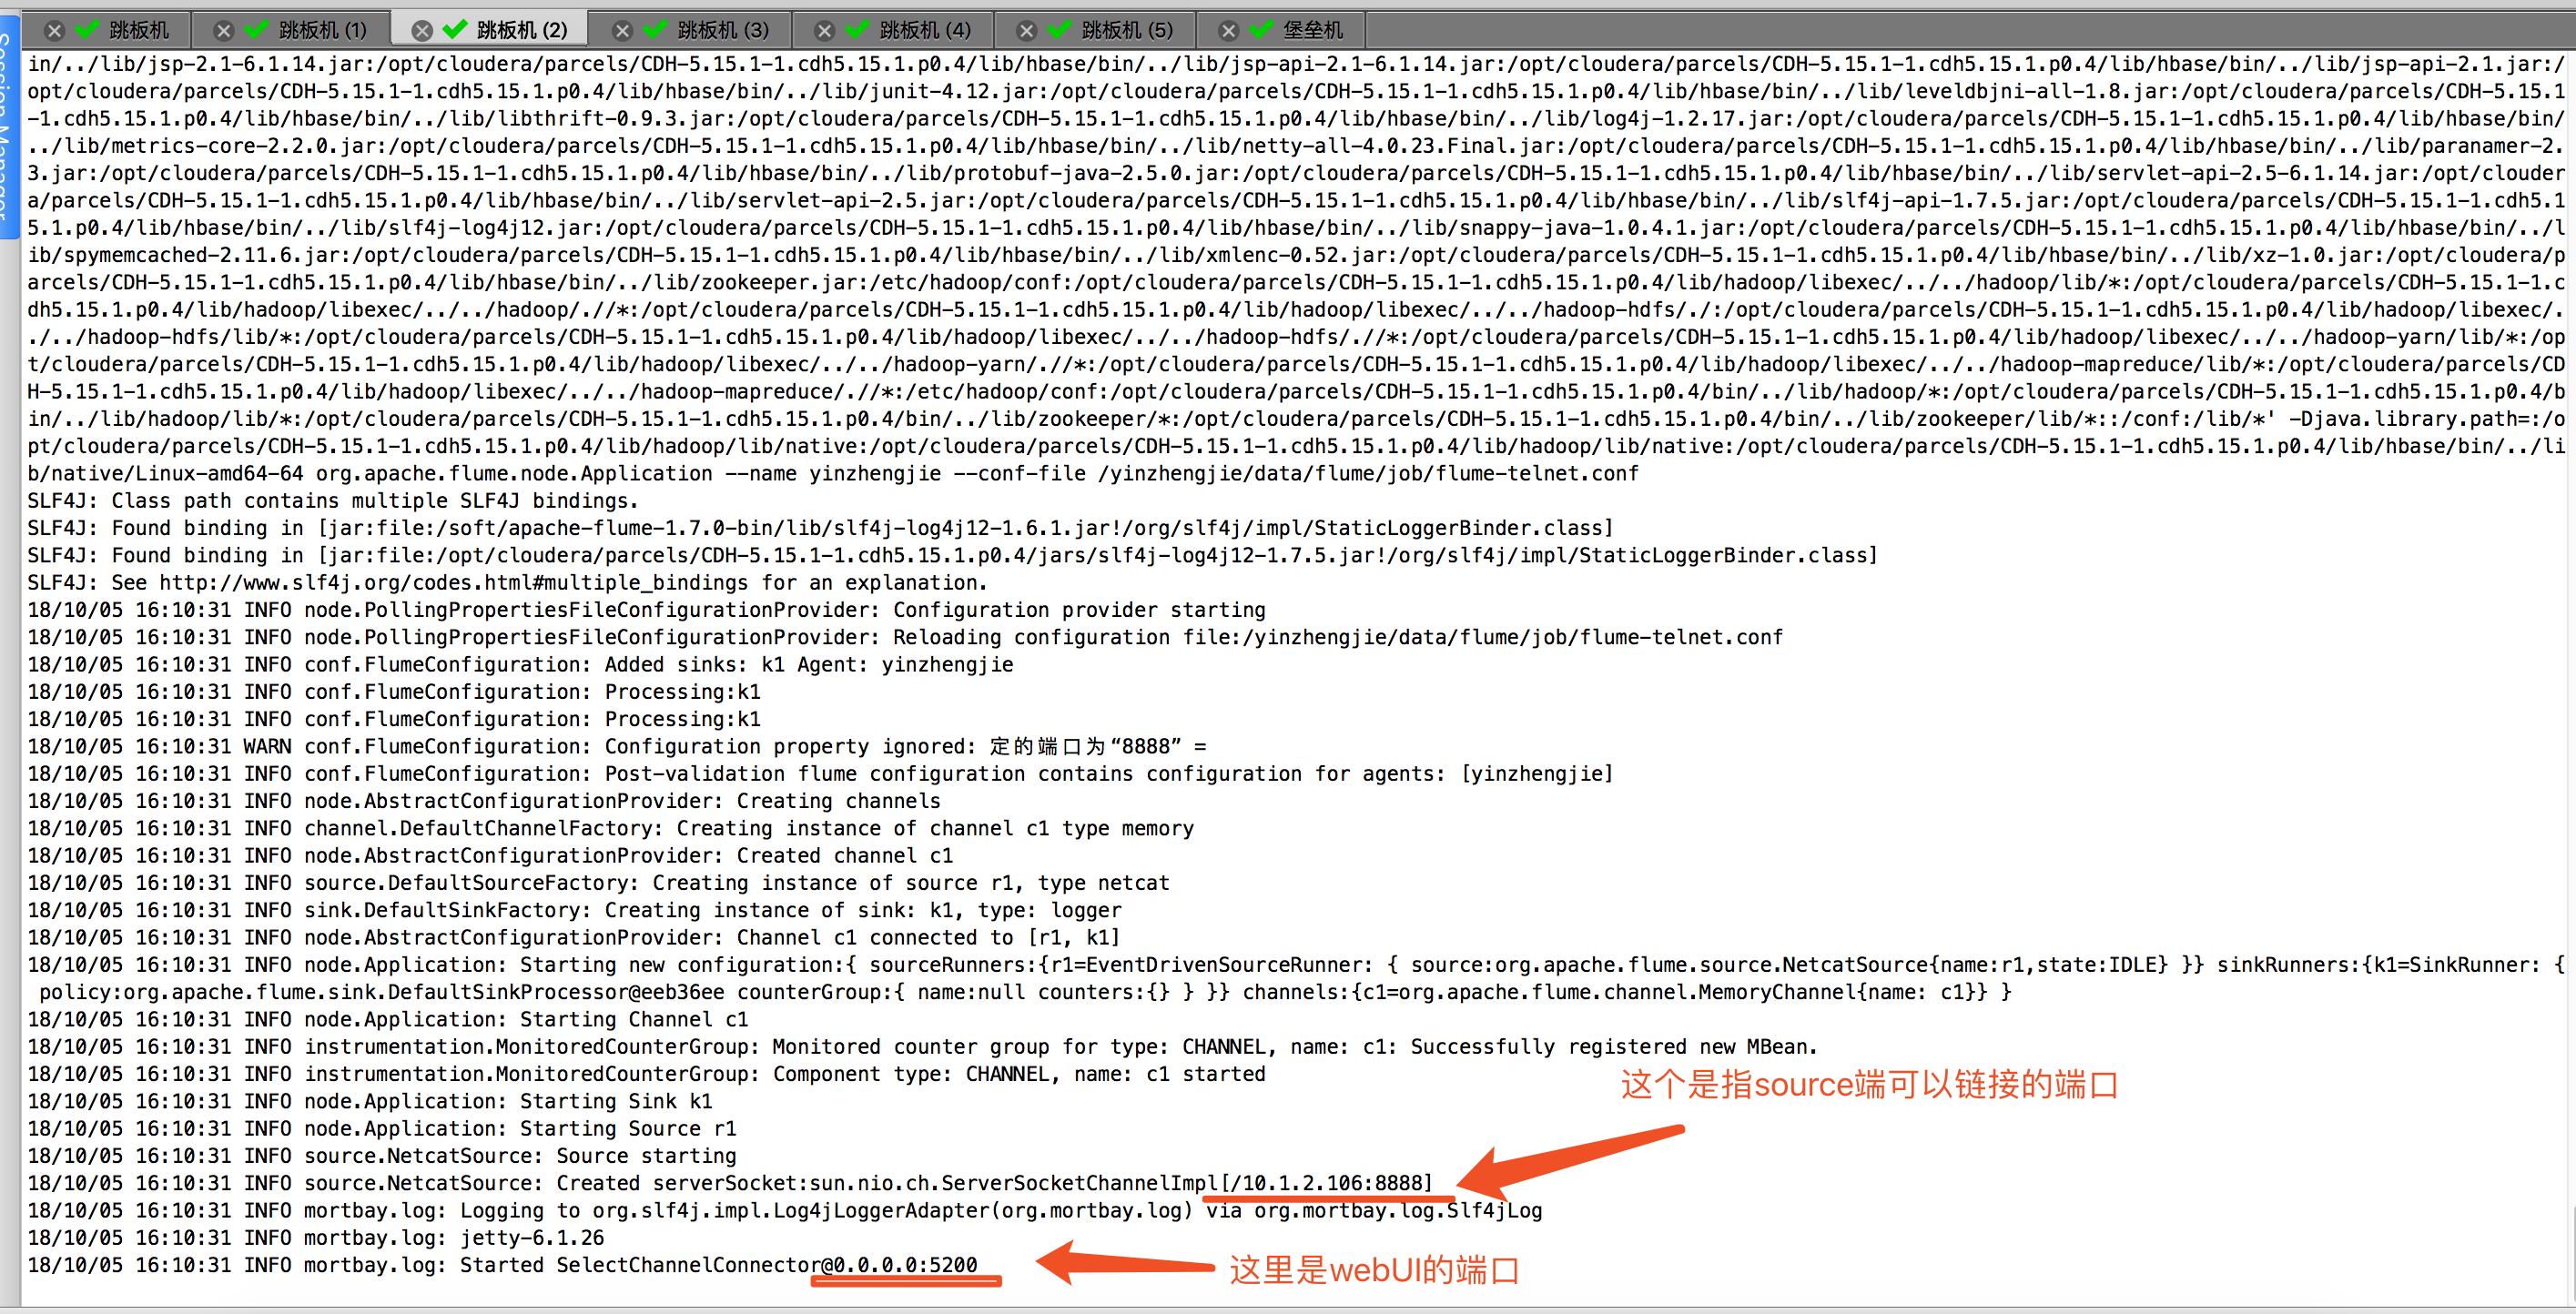
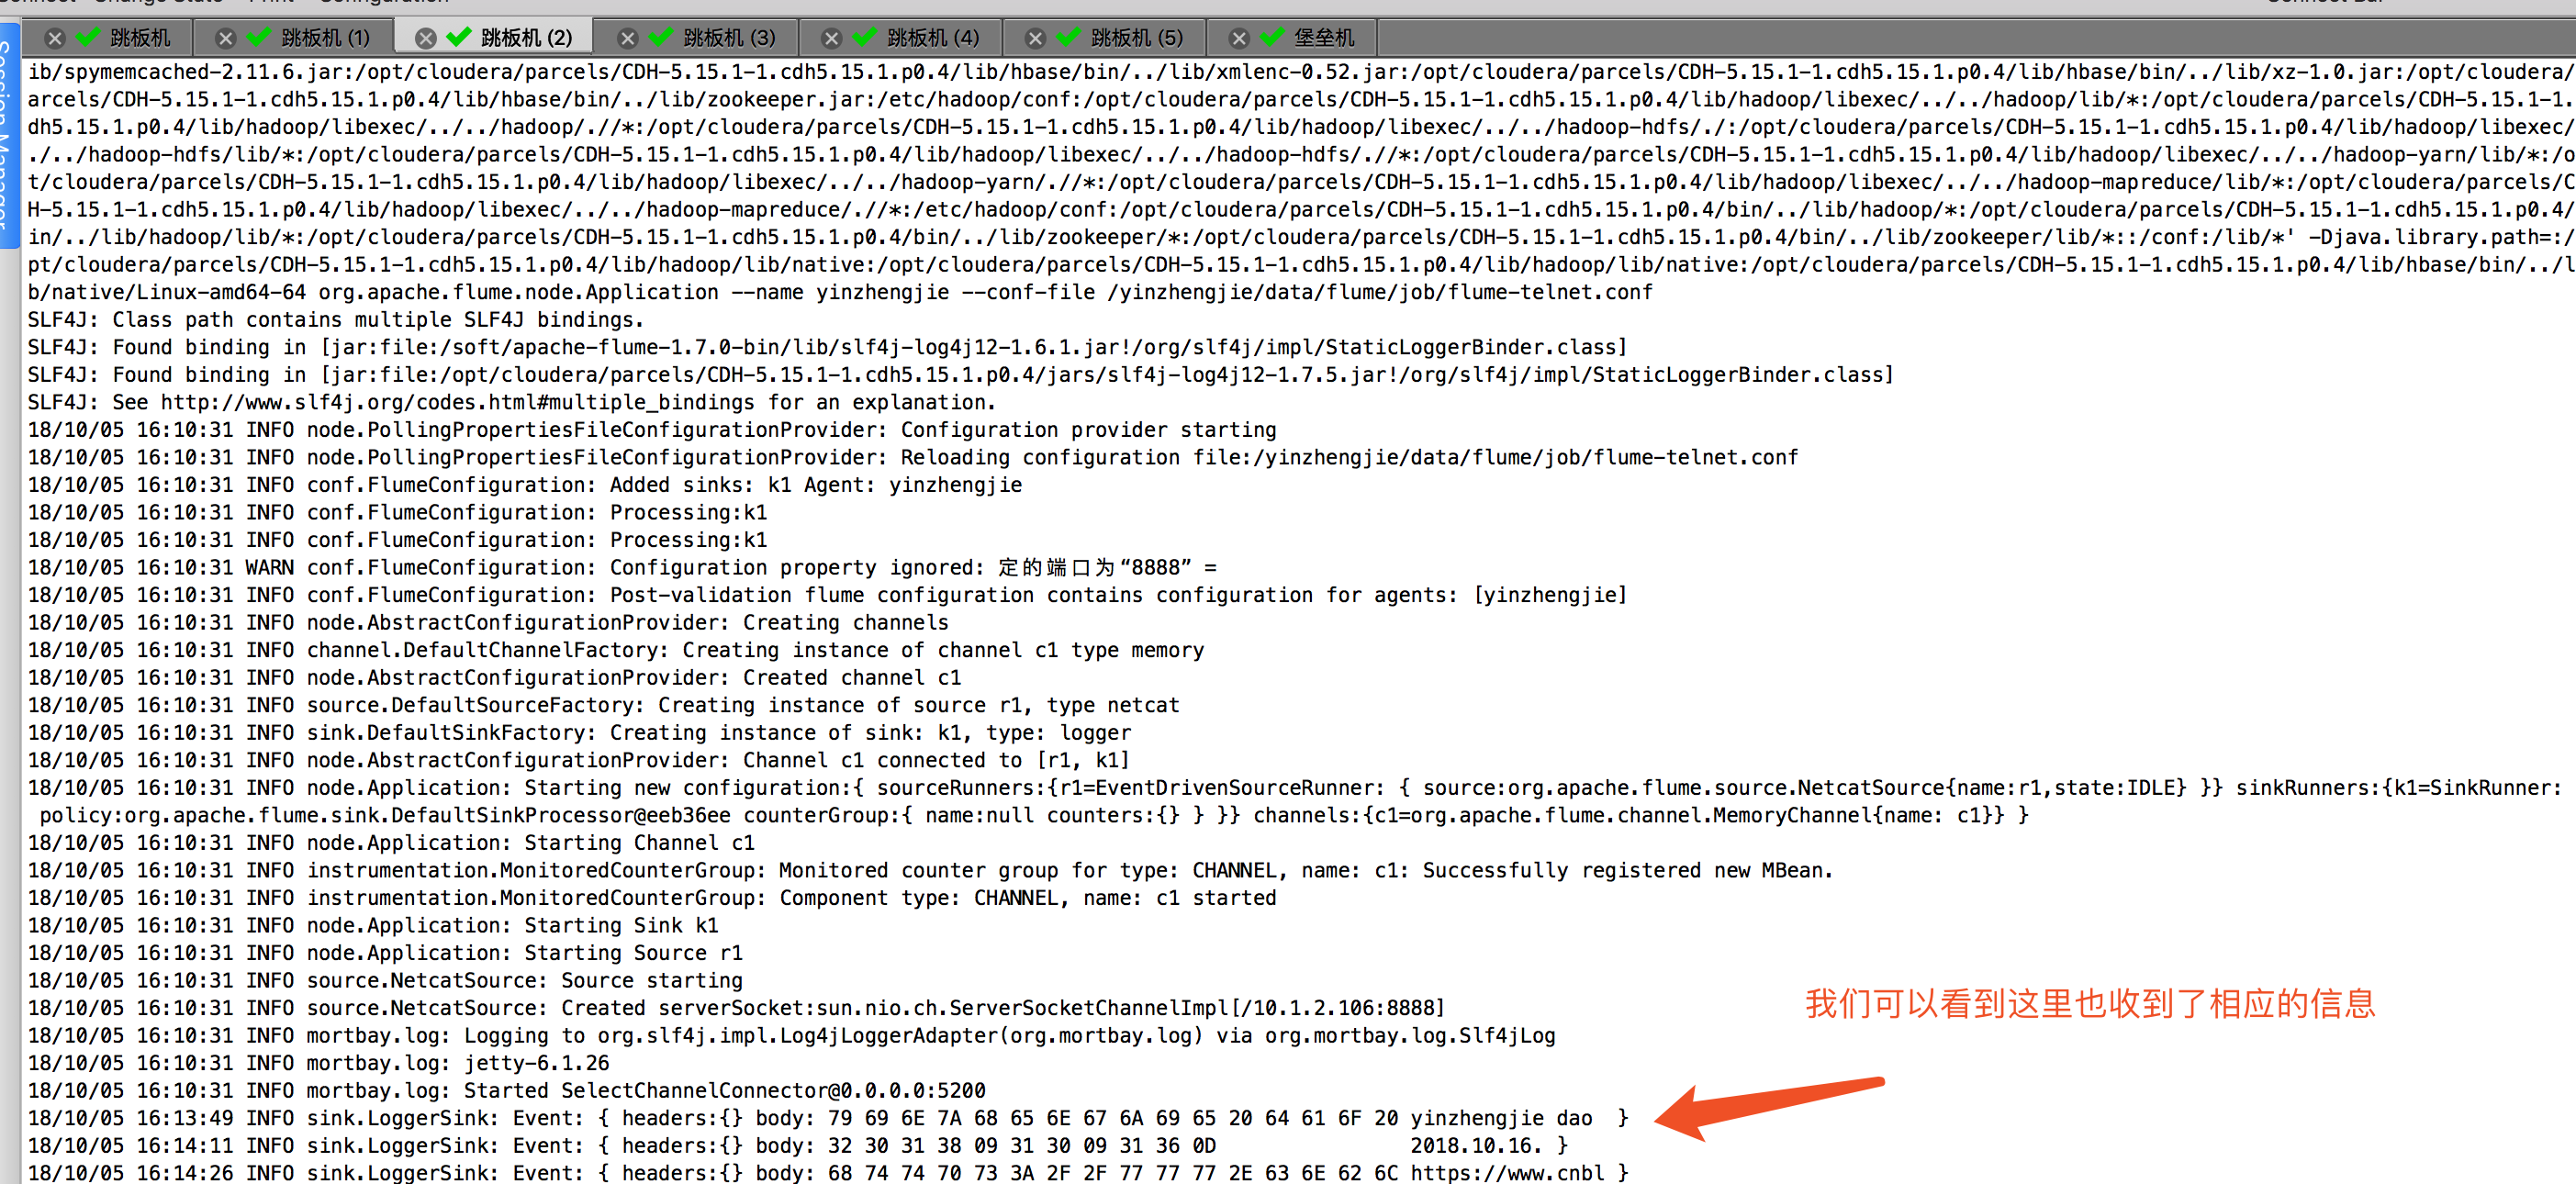
使用telnet 命令或者是nc命令去链接10.1.2.106:8888端口,会将数据发送到memory channel 中,随后会打印到控制台输出:
[root@node106 ~]# telnet node106.yinzhengjie.org.cn 8888          #我这里使用telnet进行测试,发送了3调数据。

Trying 10.1.2.106...

Connected to node106.yinzhengjie.org.cn.

Escape character is '^]'.

yinzhengjie dao ci yi you !

OK

OK

https://www.cnblogs.com/yinzhengjie/

OK
查看是否收到了相应的信息,如下图:
通过webUI查看flume的状态信息:
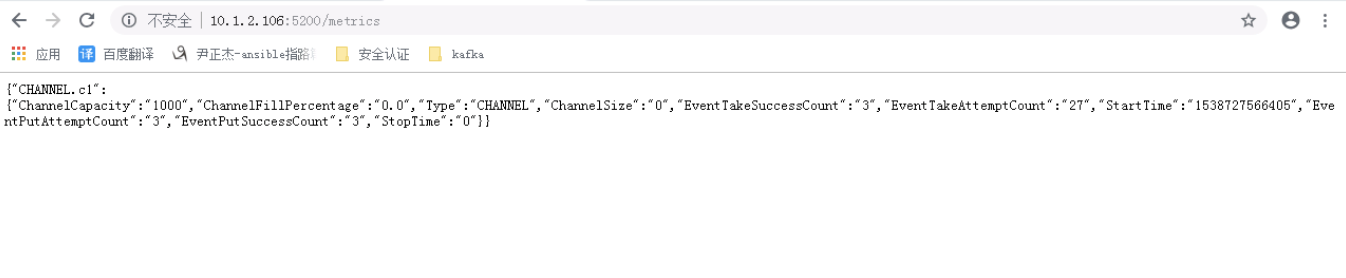
通过curl命令查看flume的状态信息:([root@node106 ~]# curl http://10.1.2.106:5200/metrics)
3>.启动flume 时,将flume的状态发送给Ganglia( -Dflume.monitoring.type=ganglia -Dflume.monitoring.hosts=10.1.2.120:8649)
[root@node106 conf]# flume-ng agent --conf /yinzhengjie/data/flume/ --name yinzhengjie --conf-file /yinzhengjie/data/flume/job/flume-telnet.conf -Dflume.monitoring.type=ganglia -Dflume.monitoring.hosts=10.1.2.120:
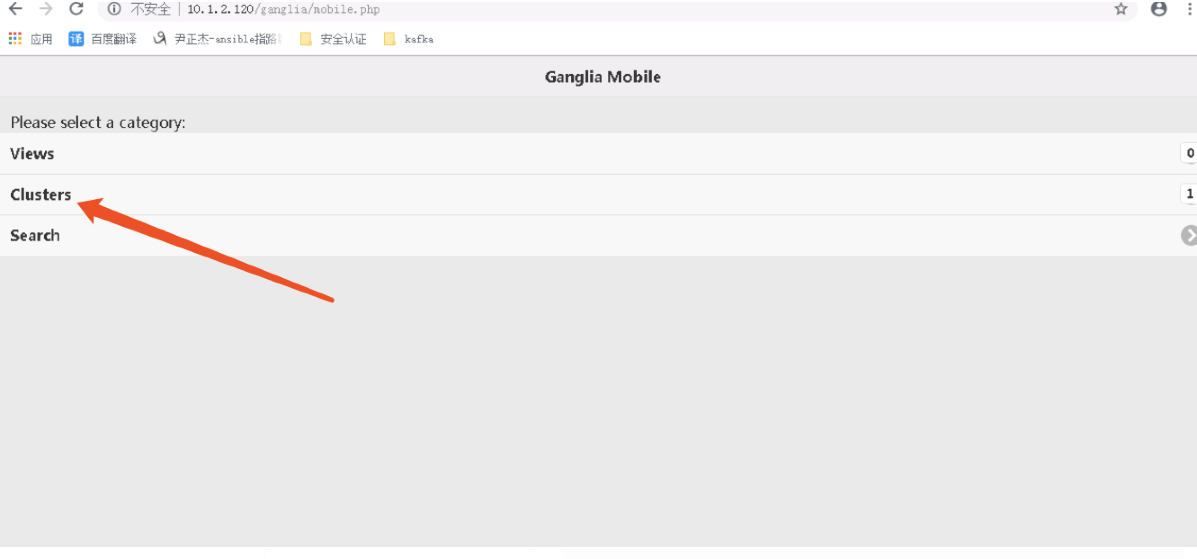
4>.查看webUI的Mobile页面信息

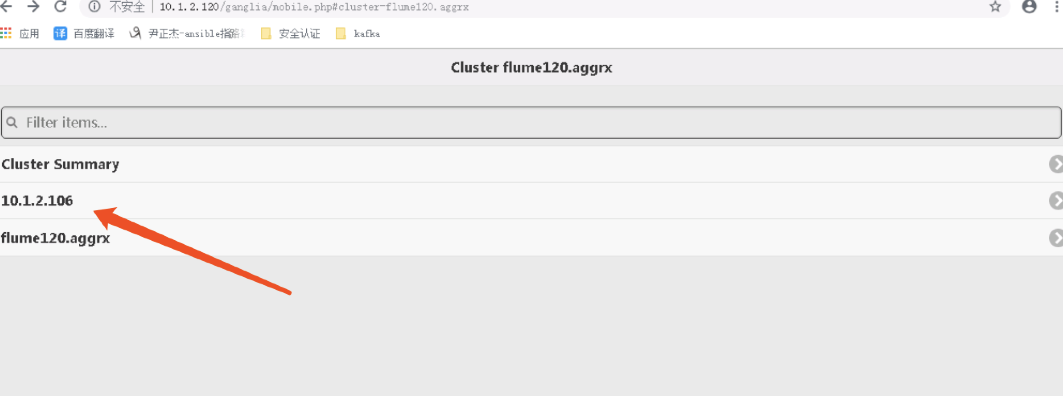
5>.查看Clusters的页面信息
6>.选择你要查看的指定机器(即,我们启动flume的服务器 )
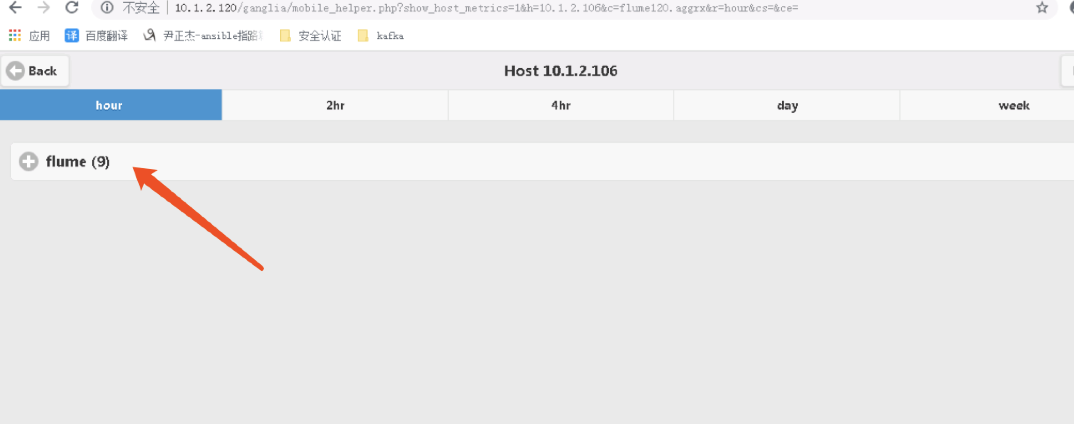
7>.查看flume的信息
8>.flume的详细信息界面
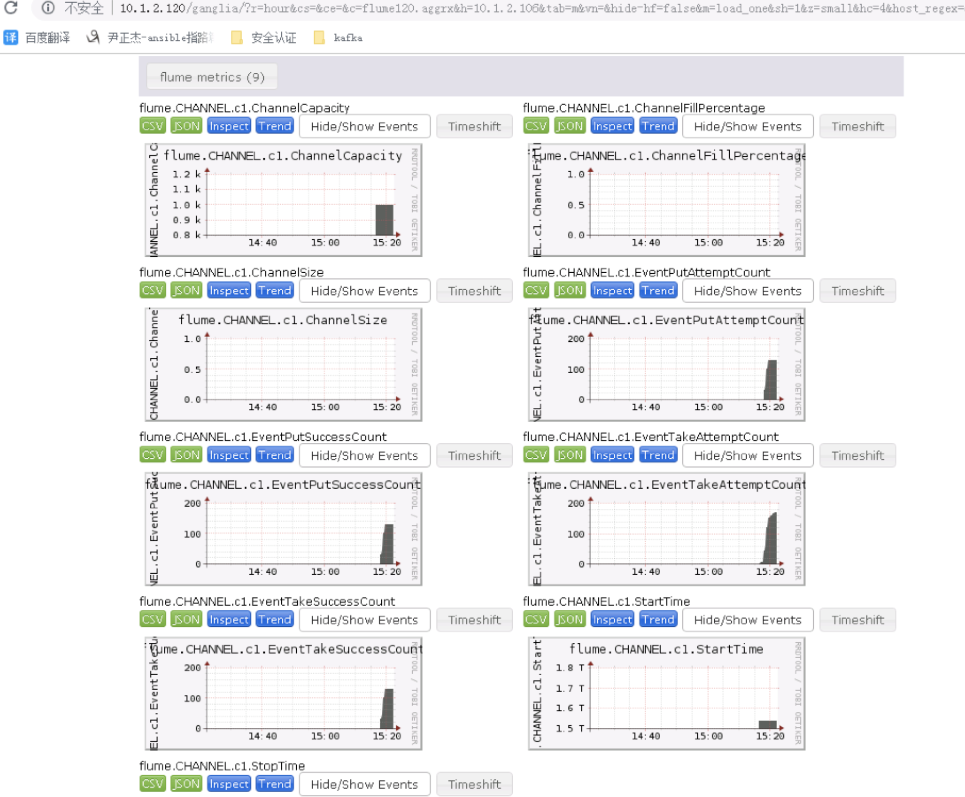
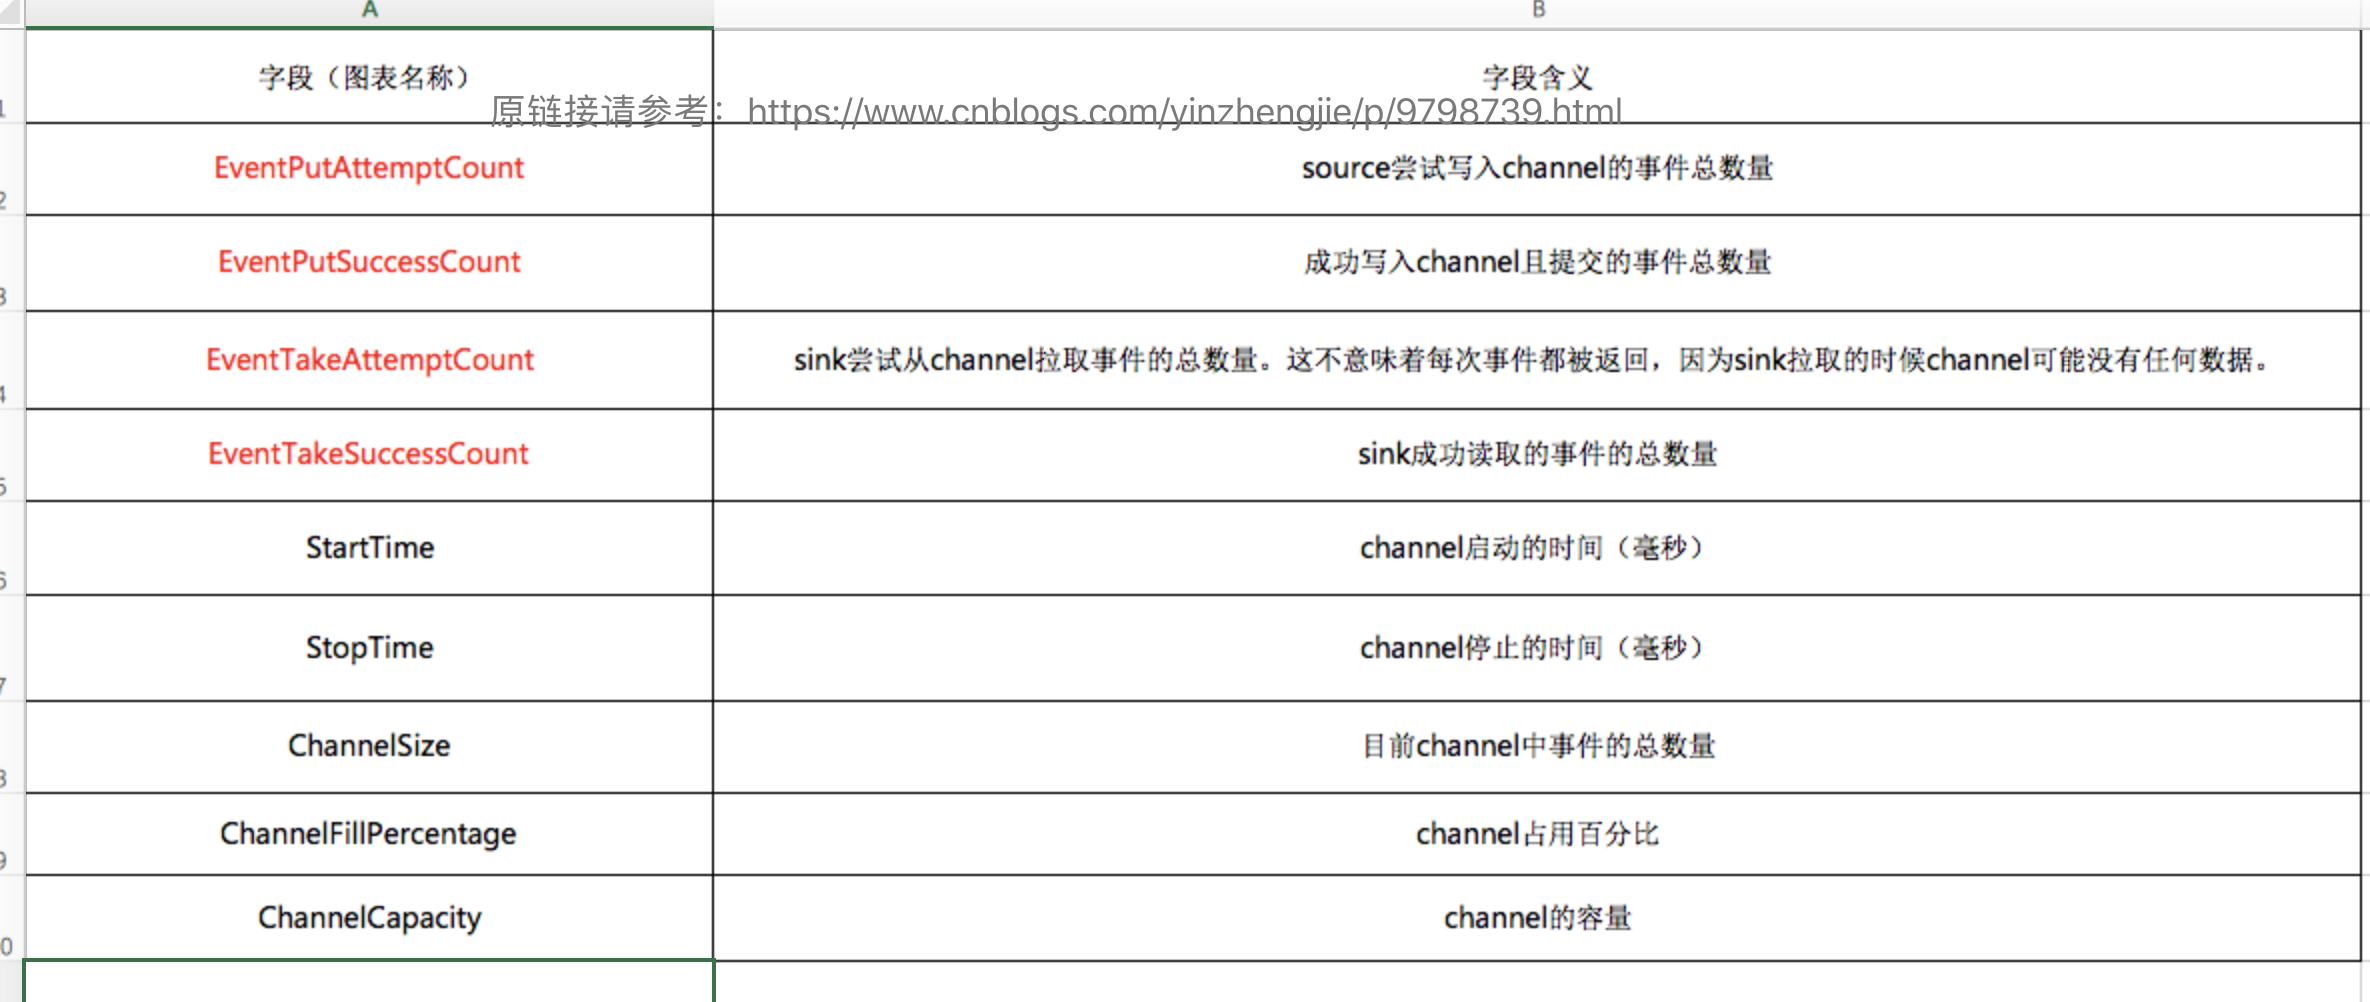
上图的英文你都认识吗?想必大家大家都很熟悉了,我这里把说明贴在下面,方便以后查看:
最新文章
- 【腾讯Bugly干货分享】Android动态布局入门及NinePatchChunk解密
- linux 文件系统
- HQL查询——HQL查询的基本用法
- Linux内核--网络栈实现分析(五)--传输层之UDP协议(上)
- linux:手动校准系统时间和硬件CMOS时间
- 《你不知道的JavaScript》第二部分:this 详解
- c++中头文件include规则浅析[译]
- DOS删除服务
- PhoneGap Xcode iOS教程
- python 时间处理
- 聊聊VUE中的nextTick
- Android群英传笔记——第十章:Android性能优化
- Hive+Sqoop+Mysql整合
- [九省联考2018]IIIDX
- 洛谷P3178 [HAOI2015]树上操作
- (转) git--Remote远程仓库的使用
- zabbix3.0使用ss命令对tcp连接数和状态的监控性能优化
- python3 元类编程的一个例子
- yii2关联查询两组一对一
- oracle查看所有表及各表行数