Echarts——更改仪表盘方向和颜色
2024-08-28 20:21:53
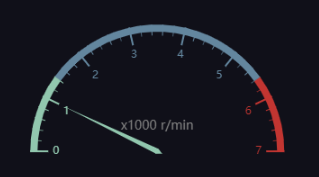
做小项目需要用到仪表盘,官方给出的颜色设置如下:
而我想要如下样式的:
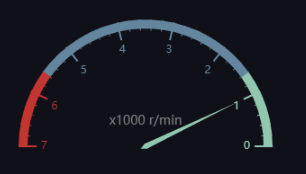
最后,经过一番折腾算是搞成了如下样式效果:

要达到上面效果关键在于设置Echarts的如下两处js代码:
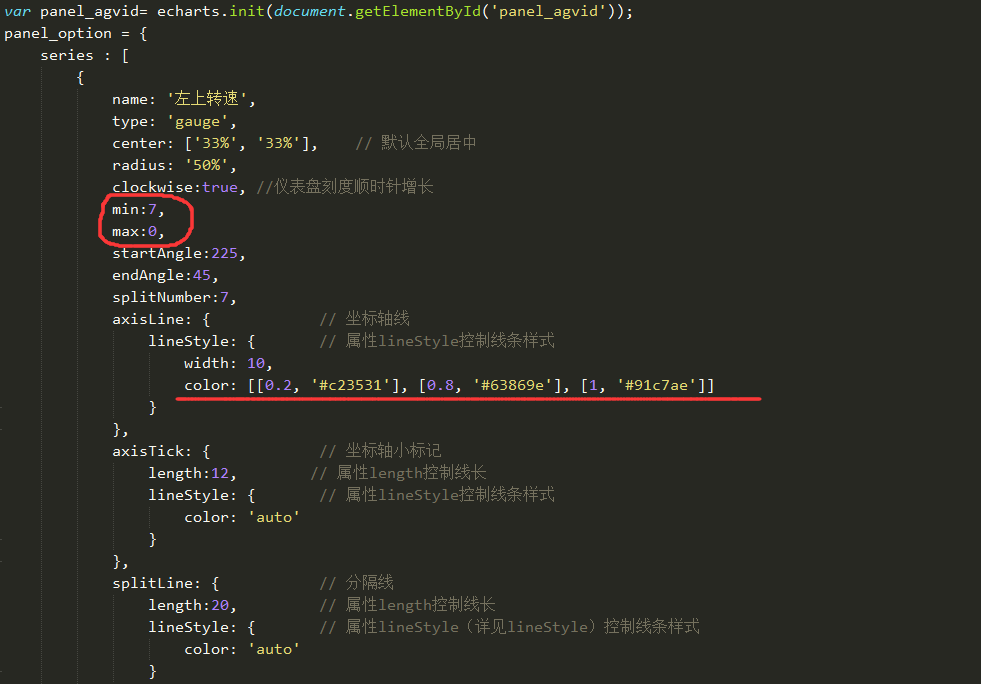
1.大小值要颠倒,因为这里的仪表刻度是顺时针增长的
2.坐标轴线的颜色要重新设置,不能用默认的,要把默认的颜色顺序颠倒过来
总体代码如下:
HTML:
<html>

  <head>

    <title>汽车仪表盘</title>

    <style>

        [v-cloak] {

          display: none;

        }

      html,body{

        height: 100%;

        width: 100%;

        padding: 0;

        margin: 0;

                background: gray;

                display: flex;/*设置为弹性容器*/

                align-items: center; /*包含的元素垂直居中*/

                justify-content: center; /*包含的元素水平居中*/

      }

      .bg_total{

                width: 80vh; /* 1vh 等于1/100的视口高度 */

        height: 80%;

        background: url(../static/img/totalBg.png) no-repeat;

        background-size: 100% 100%;

      }

      .panel_agv{

        width: 100%;

        height: 100%;

        position: relative;

                background: #101019;

      }

    </style>

  </head>

  <body>

    <div class="bg_total">

            <div id="panel_agvid" class="panel_agv"></div>

    </div>

    <script type="text/javascript" src="./js/jquery-3.2.1.min.js"></script>

    <script type="text/javascript" src="./js/echarts-en.min.js"></script>

    <script type="text/javascript" src="./js/myecharts.js"></script>

  </body>

</html>
JS:
var panel_agvid= echarts.init(document.getElementById('panel_agvid'));

panel_option = {

    series : [

        {

            name: '左上转速',

            type: 'gauge',

            center: ['33%', '33%'],    // 默认全局居中

            radius: '50%',

            clockwise:true, //仪表盘刻度顺时针增长

            min:7,

            max:0,

            startAngle:225,

            endAngle:45,

            splitNumber:7,

            axisLine: {            // 坐标轴线

                lineStyle: {       // 属性lineStyle控制线条样式

                    width: 10,

                    color: [[0.2, '#c23531'], [0.8, '#63869e'], [1, '#91c7ae']]

                }

            },

            axisTick: {            // 坐标轴小标记

                length:12,        // 属性length控制线长

                lineStyle: {       // 属性lineStyle控制线条样式

                    color: 'auto'

                }

            },

            splitLine: {           // 分隔线

                length:20,         // 属性length控制线长

                lineStyle: {       // 属性lineStyle(详见lineStyle)控制线条样式

                    color: 'auto'

                }

            },

            pointer: {

                width:3

            },

            title: {

                offsetCenter: ['0', '-20%'],       // x, y,单位px

                fontSize: 14,

                color:'gray'

            },

            detail: {

                offsetCenter: ['0', '35%'],       // x, y,单位px

                textStyle: {       // 其余属性默认使用全局文本样式

                    fontWeight: 'bolder',

                    fontSize: 18

                }

            },

            data:[{value: 0, name: 'x1000 r/min'}]

        },

        {

            name: '右上转速',

            type: 'gauge',

            center: ['66%', '33%'],    // 默认全局居中

            radius: '50%',

            min:0,

            max:7,

            startAngle:135,

            endAngle:-45,

            splitNumber:7,

            axisLine: {            // 坐标轴线

                lineStyle: {       // 属性lineStyle控制线条样式

                    width: 8

                }

            },

            axisTick: {            // 坐标轴小标记

                length:12,        // 属性length控制线长

                lineStyle: {       // 属性lineStyle控制线条样式

                    color: 'auto'

                }

            },

            splitLine: {           // 分隔线

                length:20,         // 属性length控制线长

                lineStyle: {       // 属性lineStyle(详见lineStyle)控制线条样式

                    color: 'auto'

                }

            },

            pointer: {

                width:3

            },

            title: {

                offsetCenter: ['0', '-20%'],       // x, y,单位px

                fontSize: 14,

                color:'gray'

            },

            detail: {

                offsetCenter: ['0', '35%'],       // x, y,单位px

                textStyle: {       // 其余属性默认使用全局文本样式

                    fontWeight: 'bolder',

                    fontSize: 18

                }

            },

            data:[{value: 0, name: 'x1000 r/min'}]

        },

        {

            name: '左下转速',

            type: 'gauge',

            center: ['33%', '66%'],    // 默认全局居中

            radius: '50%',

            min:0,

            max:7,

            startAngle:315,

            endAngle:135,

            splitNumber:7,

            axisLine: {            // 坐标轴线

                lineStyle: {       // 属性lineStyle控制线条样式

                    width: 8

                }

            },

            axisTick: {            // 坐标轴小标记

                length:12,        // 属性length控制线长

                lineStyle: {       // 属性lineStyle控制线条样式

                    color: 'auto'

                }

            },

            splitLine: {           // 分隔线

                length:20,         // 属性length控制线长

                lineStyle: {       // 属性lineStyle(详见lineStyle)控制线条样式

                    color: 'auto'

                }

            },

            pointer: {

                width:3

            },

            title: {

                offsetCenter: ['0', '20%'],       // x, y,单位px

                fontSize: 14,

                color:'gray'

            },

            detail: {

                offsetCenter: ['0', '-35%'],       // x, y,单位px

                textStyle: {       // 其余属性默认使用全局文本样式

                    fontWeight: 'bolder',

                    fontSize: 18

                }

            },

            data:[{value: 0, name: 'x1000 r/min'}]

        },

        {

            name: '右下转速',

            type: 'gauge',

            center: ['66%', '66%'],    // 默认全局居中

            radius: '50%',

            min:7,

            max:0,

            startAngle:45,

            endAngle:-135,

            splitNumber:7,

            axisLine: {            // 坐标轴线

                lineStyle: {       // 属性lineStyle控制线条样式

                    width: 8,

                    color: [[0.2, '#c23531'], [0.8, '#63869e'], [1, '#91c7ae']]

                }

            },

            axisTick: {            // 坐标轴小标记

                length:12,        // 属性length控制线长

                lineStyle: {       // 属性lineStyle控制线条样式

                    color: 'auto'

                }

            },

            splitLine: {           // 分隔线

                length:20,         // 属性length控制线长

                lineStyle: {       // 属性lineStyle(详见lineStyle)控制线条样式

                    color: 'auto'

                }

            },

            pointer: {

                width:3

            },

            title: {

                offsetCenter: ['0', '20%'],       // x, y,单位px

                fontSize: 14,

                color:'gray'

            },

            detail: {

                offsetCenter: ['0', '-35%'],       // x, y,单位px

                textStyle: {       // 其余属性默认使用全局文本样式

                    fontWeight: 'bolder',

                    fontSize: 18

                }

            },

            data:[{value: 0, name: 'x1000 r/min'}]

        }

     ]

};

setInterval(function (){

    panel_option.series[0].data[0].value = 1;

    panel_option.series[1].data[0].value = 1;

    panel_option.series[2].data[0].value = 1;

    panel_option.series[3].data[0].value = 1;

    panel_agvid.setOption(panel_option,true);

},2000);
只要再设置一个js全局变量对象就可以实现仪表盘数值的实时更新!
最新文章
- CentOS 6中MATLAB print函数“所见非所得”bug的解决方案
- JS打印页面指定区域
- VMware Data Recovery备份恢复vmware虚拟机
- BZOJ2827: 千山鸟飞绝
- [Javascript] Limit Built Branches on Travis
- 哈希表--HashSet<T>
- NTFS reparse point
- python3图片裁剪+转换pdf+压缩
- UIViewCotroller 的生命周期函数
- 如何利用SecureCRT连接Ubuntu12.0.4
- Unity3d 真实的植物渲染
- Android Proguard
- 用htaccess进行访问控制(转)
- windows7下virtualBox配置识别usb
- Nagios的客户端的安装
- js缓冲运动
- Kindergarten Counting Game - UVa494
- 无法向Windows服务器复制粘贴文件
- Python+Flask搭建mock api server
- TCP-IP详解笔记6