ELK日志处理
ELK的工作原理:
使用多播进行机器发现同一个集群内的节点,并汇总各个节点的返回组成一个集群,主节点要读取各个节点的状态,在关键时候进行数据的恢复,主节点会坚持各个节点的状态,并决定每个分片的位置,通过ping的request检测各失效的节点.
ELK架构:

ElasticSearch:用于存储、索引日志.
Logstash:用于收集、处理和转发事件或日志信息的工具.
Kibana:搜索和可视化的日志的WEB界面.
ELK优点:
a.处理方式灵活:ElasticSearch是实时全文索引.
b.配置简单易上手.
c.检索性能高效:虽然每次计算都是实时计算的,但是优秀的设计基本可以达到全天数据查询的秒级响应.
d.集群线性扩展:ElasticSearch和Logstash集群都是可以线性扩展的.
e.前端操作绚丽:Kibana界面上,只需要点击鼠标,就可以完成搜索、聚合功能,生成绚丽的仪表板.

0.安装前准备:
ElasticSearch和Logstash需要java环境,需要安装JDK1.7以上的版本.
a.下载JDK的rpm包
b.安装
c.Java -version :检测安装的JDK
Elasticsearch:
概念:
1.索引:数据会放在多个索引中,索引可以理解为database,索引里面存放的基本单位是文档,elasticsearch会把索引分片,便于横向扩展,分别可以做备份,多个分片读比较快,备份分片在主的挂掉之后可以自动将自己提升为主分片(实现横向扩展和冗余)
2.文档类型:和redis一样,key是有类型的
3.节点:一个elasticsearch的实例是一个节点
4.集群:多节点的集合组成集群,类似于zookeeper会选举出主节点,客户端不需要关注主节点,连接任何一个都可以,数据会自动同步.
安装Elasticsearch
a.wget https://download.elastic.co/elasticsearch/release/org/elasticsearch/distribution/rpm/elasticsearch/2.3.5/elasticsearch-2.3.5.rpm
b.rpm -ivh elasticsearch-2.3.5.rpm
c.mkdir /opt/develop/elasticsearch/data -p
mkdir /opt/develop/elasticsearch/log -p
d.# vi /usr/share/elasticsearch/config/elasticsearch.yml
Cluster.name:my-application --集群的名称,名称相同就是一个集群
Node.name:node-1 --集群情况下,当前node的名字,每个node应该不一样
Path.data=/opt/develop/elasticsearch/data
Path.log=/opt/develop/elasticsearch/log
Network.host=xxx.xxx.xx.xx
http.port:9200 --客户端访问端口
node.max_local_storage_nodes: 1
e.ElasticSearch需要使用非root用户启动服务
Groupadd ela
Useradd ela -g ela -p xxx
Su – ela
执行安装路径下的/elasticsearch启动服务
f.curl -X GET http://localhost:9200/ 查看ElasticSearch的安装信息----启动成功

g.chkconfig –add elasticsearch
Elasticsearch集群:
1.基于http的restful API:以jsop返回查询结果:
$curl -XGET http://10.26.44.42:9200/_count?pretty -d '
{
"query":{
"match_all":{}
}
}
'
{
"count" : 308590265,
"_shards" : {
"total" : 4180,
"successful" : 4180,
"failed" : 0
}
}
安装Logstash
a.wget https://download.elastic.co/logstash/logstash/packages/centos/logstash-2.3.4-1.noarch.rpm
b.安装
c.启动服务
d.测试:cd /opt/logstash/bin
./logstash -e ‘input { stdin {} } output { stdout {} }’

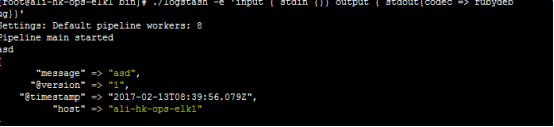
e.使用ruby进行更详细的输出:
./logstash -e 'input { stdin {}} output { stdout{codec => rubydebug}}'
Settings: Default pipeline workers: 8
Pipeline main started
asd
{
"message" => "asd",
"@version" => "1",
"@timestamp" => "2017-02-13T08:39:56.079Z",
"host" => "ali-hk-ops-elk1"
}
f.通过logstash将输出交给elasticsearch:
./logstash -e ‘input { stdin{} } output { elasticsearch { host => “ali-hk-ops-elk1:9200”protocol => “http”} }’
g.配置文件格式:
input {
file {
path => “/var/log/messages”
type => “syslog”
}
file {
path => “/var/log/apache/access.log”
type => “apache”
}
}
Logstash的input使用语法:
1.input,默认不支持目录的递归,即目录中还有文件是不支持直接读取的,但是可以使用/进行匹配
2.Exclude---->排除文件
Exclude => “*.gz”
3.sincedb_path,记录读取的时候位置,默认是一个隐藏文件
4.Sincedb_write_interval,记录sincedb_path文件的写间隔,默认是15秒
5.Start_position,从这个文件的什么位置开始读,默认是end,可以改成beginning
6.start_interval,多久检测一次此文件的更新状态
logstash的output使用及插件:
1.可以输出到文件、redis等
2.gzip,是否压缩,默认为false,压缩是安装数据流一点点增量压缩的
3.Message_format,消息的格式
Logstash-->file-->elasticsearch:
通过logstash输出到文件再输出到elasticsearch;
1.启动脚本:
Vim /etc/init.d/logstash
-#!/bin/sh
-# Init script for logstash
-# Maintained by Elasticsearch
-# Generated by pleaserun.
-# Implemented based on LSB Core 3.1:
-# * Sections: 20.2, 20.3
-#
-### BEGIN INIT INFO
-# Provides: logstash
-# Required-Start: $remote_fs $syslog
-# Required-Stop: $remote_fs $syslog
-# Default-Start: 2 3 4 5
-# Default-Stop: 0 1 6
-# Short-Description:
-# Description: Starts Logstash as a daemon.
-### END INIT INFO
PATH=/sbin:/usr/sbin:/bin:/usr/bin
export PATH
if [ id -u -ne 0 ]; then
echo "You need root privileges to run this script"
exit 1
fi
name=logstash
pidfile="/var/run/$name.pid"
LS_USER=logstash
LS_GROUP=logstash
LS_HOME=/var/lib/logstash
LS_HEAP_SIZE="4g"
LS_LOG_DIR=/var/log/logstash
LS_LOG_FILE="${LS_LOG_DIR}/$name.log"
LS_CONF_DIR=/etc/logstash/conf.d
LS_OPEN_FILES=16384
LS_NICE=19
KILL_ON_STOP_TIMEOUT=${KILL_ON_STOP_TIMEOUT-0} #default value is zero to this variable but could be updated by user request
LS_OPTS=""
[ -r /etc/default/$name ] && . /etc/default/$name
[ -r /etc/sysconfig/$name ] && . /etc/sysconfig/$name
program=/opt/logstash/bin/logstash
args="agent -f ${LS_CONF_DIR} -l ${LS_LOG_FILE} ${LS_OPTS}"
quiet() {
"$@" > /dev/null 2>&1
return $?
}
start() {
LS_JAVA_OPTS="${LS_JAVA_OPTS} -Djava.io.tmpdir=${LS_HOME}"
HOME=${LS_HOME}
export PATH HOME LS_HEAP_SIZE LS_JAVA_OPTS LS_USE_GC_LOGGING LS_GC_LOG_FILE
-# chown doesn't grab the suplimental groups when setting the user:group - so we have to do it for it.
-# Boy, I hope we're root here.
SGROUPS=$(id -Gn "$LS_USER" | tr " " "," | sed 's/,$//'; echo '')
if [ ! -z $SGROUPS ]
then
EXTRA_GROUPS="--groups $SGROUPS"
fi
-# set ulimit as (root, presumably) first, before we drop privileges
ulimit -n ${LS_OPEN_FILES}
-# Run the program!
nice -n ${LS_NICE} chroot --userspec $LS_USER:$LS_GROUP $EXTRA_GROUPS / sh -c "
cd $LS_HOME
ulimit -n ${LS_OPEN_FILES}
exec "$program" $args
" > "${LS_LOG_DIR}/$name.stdout" 2> "${LS_LOG_DIR}/$name.err" &
-# Generate the pidfile from here. If we instead made the forked process
-# generate it there will be a race condition between the pidfile writing
-# and a process possibly asking for status.
echo $! > $pidfile
echo "$name started."
return 0
}
stop() {
-# Try a few times to kill TERM the program
if status ; then
pid=cat "$pidfile"
echo "Killing $name (pid $pid) with SIGTERM"
kill -TERM $pid
-# Wait for it to exit.
for i in 1 2 3 4 5 6 7 8 9 ; do
echo "Waiting $name (pid $pid) to die..."
status || break
sleep 1
done
if status ; then
if [ $KILL_ON_STOP_TIMEOUT -eq 1 ] ; then
echo "Timeout reached. Killing $name (pid $pid) with SIGKILL. This may result in data loss."
kill -KILL $pid
echo "$name killed with SIGKILL."
else
echo "$name stop failed; still running."
return 1 # stop timed out and not forced
fi
else
echo "$name stopped."
fi
fi
}
status() {
if [ -f "$pidfile" ] ; then
pid=cat "$pidfile"
if kill -0 $pid > /dev/null 2> /dev/null ; then
-# process by this pid is running.
-# It may not be our pid, but that's what you get with just pidfiles.
-# TODO(sissel): Check if this process seems to be the same as the one we
-# expect. It'd be nice to use flock here, but flock uses fork, not exec,
-# so it makes it quite awkward to use in this case.
return 0
else
return 2 # program is dead but pid file exists
fi
else
return 3 # program is not running
fi
}
reload() {
if status ; then
kill -HUP cat "$pidfile"
fi
}
force_stop() {
if status ; then
stop
status && kill -KILL cat "$pidfile"
fi
}
configtest() {
-# Check if a config file exists
if [ ! "$(ls -A ${LS_CONF_DIR}/* 2> /dev/null)" ]; then
echo "There aren't any configuration files in ${LS_CONF_DIR}"
return 1
fi
HOME=${LS_HOME}
export PATH HOME
test_args="--configtest -f ${LS_CONF_DIR} ${LS_OPTS}"
$program ${test_args}
[ $? -eq 0 ] && return 0
-# Program not configured
return 6
}
case "$1" in
start)
status
code=$?
if [ $code -eq 0 ]; then
echo "$name is already running"
else
start
code=$?
fi
exit $code
;;
stop) stop ;;
force-stop) force_stop ;;
status)
status
code=$?
if [ $code -eq 0 ] ; then
echo "$name is running"
else
echo "$name is not running"
fi
exit $code
;;
reload) reload ;;
restart)
quiet configtest

RET=$?

if [ ${RET} -ne 0 ]; then

  echo "Configuration error. Not restarting. Re-run with configtest parameter for details"

  exit ${RET}

fi

stop && start

;;
configtest)
configtest
exit $?
;;
*)
echo "Usage: $SCRIPTNAME {start|stop|force-stop|status|reload|restart|configtest}" >&2
exit 3
;;
esac
exit $?
分析的日志类型:
1.系统日志:/var/log下的所有的内容,google每一个文件的内容
2.通过elasticsearch分析某一个访问记录
3.错误日志,收集后反馈给开发
4.系统运行日志
5.其他类型的日志
日志的字段划分:
1.gork模块:通过正则表达式,比较复杂,而且当数据大的时候会占用CPU
2.Json,简单易用
3.将nginx的日志设置为json模式
安装kibana
a.wget https://download.elastic.co/kibana/kibana/kibana-4.5.4-1.x86_64.rpm
b.安装
c.vi /opt/kibana/config/kibana.yml
server.port:5601
server.host:’0.0.0.0’
elasticsearch.url:’http://xxx.xxx.xx.xx:9200’
d.service kibana start
e.chkconfig –add kibana
f.访问网页:http://localhost:5601

常用模块:
1.系统日志收集--->syslog:配置syslog结果写入到elasticsearch,指定端口514,主机就是要收集日志的服务器IP地址
2.访问日志:nginx转换成json格式
3.错误日志:使用codec插件:
Input {
Stdin {
Codec =>multiline {
Pattern => “^\s”
Negate => “false”
What => “previous”
}
}
}
Pattern:使用正则表达式匹配文件.
Negate的默认值为false,当设置为true的时候,不匹配pattern的信息会继续执行what的内容.
What:值为previous或next:将匹配到的信息合并到前一行还是下一行.
4.运行日志codec =>json,如果不是json要使用gork进行匹配
在地图显示IP的访问次数统计:
1.在easticsearch服务器用户家目录下载一个filebeat:
2.加载模板:
$curl -XPUT 'http://10.26.44.42:9200/_template/filebeat?pretty' -d@/etc/filebeat/filebeat.template.json
$curl -XPUT 'http://10.26.44.42:9200/_template/filebeat?pretty' -d@/etc/filebeat/filebeat.template-es2x.json
$curl -XPUT 'http://10.26.44.42:9200/_template/filebeat?pretty' -d@/root/filebeat.template.json
3.下载GeoIP数据库文件:
$cd /opt/logstash
$curl -o “http://geolite.maxmind.com/download/geoip/database/GeoLiteCity.dat.gz”
$gunzip GeoLiteCity.dat.gz
4.配置logstash使用GeoIP:
input {
redis {
data_type => "list"
key => "mobile-tomcat-access-log"
host => "192.168.0.251"
port => "6379"
db => "0"
codec => "json"
}
}
--#input部分为从redis读取客户端logstash分析提交后的访问日志
filter {
if [type] == "mobile-tomcat" {
geoip {
source => "client" --client 是客户端logstash收集日志时定义的公网IP的key名称,一定要和实际名称一致,因为要通过此名称获取到其对于的ip地址
target => "geoip"
database => "/etc/logstash/GeoLiteCity.dat"
add_field => [ "[geoip][coordinates]", "%{[geoip][longitude]}" ]
add_field => [ "[geoip][coordinates]", "%{[geoip][latitude]}" ]
}
mutate {
convert => [ "[geoip][coordinates]", "float"]
}
}
}
output {
if [type] == "mobile-tomcat" {
elasticsearch {
hosts => ["192.168.0.251"]
manage_template => true
index => "logstash-mobile-tomcat-access-log-%{+YYYY.MM.dd}" --index的名称一定要是logstash开头的,否则会在使用地图的时候出现geoIP type无法找找到的类似错误
flush_size => 2000
idle_flush_time => 10
}
}
}
5.在kibana界面添加新的索引:
visualize---->Tile map---->From a new search---->Select a index patterm--->选择之前的index---->Geo coordinates
【参考文档:】
1.https://www.elastic.co/guide/index.html
2.http://www.ttlsa.com/elk/howto-install-elasticsearch-logstash-and-kibana-elk-stack/
3.https://www.elastic.co/guide/en/logstash/current/plugins-inputs-log4j.html
4.http://blog.chinaunix.net/xmlrpc.php?r=blog/article&uid=21142030&id=5671032
6.http://517sou.net/archives/centos下使用elk套件搭建日志分析和监控平台/
问题:
1.重新启动elasticsearch后,报错:Elasticsearch is still initializing the kibana index.
解决:curl -XDELETE http://localhost:9200/.kibana
---上述方法会丢失所有的kibana配置,索引、图、仪表板,如果只是区分索引,可使用以下方法:
curl -s http://localhost:9200/.kibana/_recovery?pretty
curl -XPUT 'localhost:9200/.kibana/_settings' -d '
{
"index" : {
"number_of_replicas" : 0
}
}'
修改后还有报错的话,重启kibana.
哈哈!忘记重启elasticsearch,导致页面索引丢失,没有数据.
添加索引模板:
$curl -XPUT 'http://10.26.44.42:9200/_template/filebeat?pretty' -d@/root/filebeat.template.json
模板文件:
Vim /root/fillebeat.template.json
{
"mappings": {
"default": {
"_all": {
"enabled": true,
"norms": {
"enabled": false
}
},
"dynamic_templates": [
{
"template1": {
"mapping": {
"doc_values": true,
"ignore_above": 1024,
"index": "not_analyzed",
"type": "{dynamic_type}"
},
"match": ""
}
}
],
"properties": {
"geoip": {
"properties" : {
"location": {
"type": "geo_point"
},
"ip": { "type": "ip" },
"coordinates": { "type": "geo_point" }
}},
"@timestamp": {
"type": "date"
},
"message": {
"type": "string",
"index": "analyzed"
},
"offset": {
"type": "long",
"doc_values": "true"
}
}
}
},
"settings": {
"index.refresh_interval": "5s"
},
"template": "filebeat-"
}
查看集群的状态:
$ curl -XGET 'http://10.26.44.42:9200/_cluster/health?pretty=true'
{
"cluster_name" : "elks",
"status" : "red",
"timed_out" : false,
"number_of_nodes" : 3,
"number_of_data_nodes" : 3,
"active_primary_shards" : 5269,
"active_shards" : 6812,
"relocating_shards" : 0,
"initializing_shards" : 6,
"unassigned_shards" : 4151,
"delayed_unassigned_shards" : 0,
"number_of_pending_tasks" : 5136,
"number_of_in_flight_fetch" : 0,
"task_max_waiting_in_queue_millis" : 4711822,
"active_shards_percent_as_number" : 62.10228826693409
}
查看unassigned_shards:
$curl -s 'http://10.26.44.42:9200/_cat/shards' | grep UNASSIGNED | awk '{print $1}' | sort | uniq
elk集群存在问题:单节点删除过索引
将unassigned_shards删除后,重启elasticsearch,服务状态正常.
将unassigned_shards清除:
curl -XPUT 'localhost:9200/_all/_settings?pretty' -H 'Content-Type: application/json' -d'
{
"settings": {
"index.unassigned.node_left.delayed_timeout": "0"
}
}
'
最新文章
- php中用foreach改变数组的值的问题
- ACM: NBUT 1105 多连块拼图 - 水题 - 模拟
- .VDI manual Technical Logistics - Volume 2: Industrial Trucks
- django makemigrations的一个特性
- sky
- Javascript - 数组去重复
- IIS Express简介
- JavaScript 类
- WEB可用性、可访问性、可维护性
- 用STRACE解决公司真实故障一例
- 项目中Spring注入报错小结
- PHP自学2——将用户提交表单存储到外部普通文件中
- 网络编程TCP协议-聊天室
- 微信网页授权redirect_uri错误的可能错误之一
- Python中的音频和数字信号处理(DSP)
- POJ1192最优连通子串----树形dp
- (23)ajax实现上传文件的功能
- Unreal Engine 4 基于Kajiya-Kay的材质迭代
- JVM虚拟机-类加载器子系统
- bootstrap 引用注意事项