原始感知机入门——python3实现
2024-09-24 02:07:41
运用最简单的原始(对应的有对偶)感知机算法实现线性分类。
参考书目:《统计学习方法》(李航)
算法原理:
踩到的坑:以为误分类的数据只使用一次,造成分类结果很差,在train函数内加个简单的递归,解决问题;不同的学习率结果差别很大,通过循环学习率取最优解决。
AND:个人理解尚浅,理论和代码都未免有差错,欢迎指出错误共同学习,不胜感激。
代码如下:win7 32bit + python3.4 + pycharm
import numpy as np
from matplotlib import pyplot as plt # train matrix
def get_train_data():
M1 = np.random.random((100,2))
M11 = np.column_stack((M1,np.ones(100)))
M2 = np.random.random((100,2)) - 0.7
M22 = np.column_stack((M2,np.ones(100)*(-1)))
MA = np.vstack((M11,M22)) plt.plot(M1[:,0],M1[:,1], 'ro')
plt.plot(M2[:,0],M2[:,1], 'go')
min_x = np.min(M2)
max_x = np.max(M1)
# 此处返回 x 是为了之后作图方便
x = np.linspace(min_x, max_x, 100) return MA,x # 方便在train函数中识别误分类点
def func(w,b,xi,yi):
num = yi*(np.dot(w,xi)+b)
return num # 训练training data
def train(MA, w, b):
# M 存储每次处理后依旧处于误分类的原始数据
M = []
for sample in MA:
xi = sample[0:2]
yi = sample[-1]
# 如果为误分类,改变w, b
# n 为学习率
if func(w,b,xi,yi) <= 0:
w += n*yi*xi
b += n*yi
M.append(sample)
if len(M) > 0:
# print('迭代...')
train(M, w, b)
return w,b # 作出分类线的图
def plot_classify(w,b,x, rate0):
y = (w[0]*x+b)/((-1)*w[1])
plt.plot(x,y)
plt.title('Accuracy = '+str(rate0)) # 随机生成testing data 并作图
def get_test_data():
M = np.random.random((50,2))
plt.plot(M[:,0],M[:,1],'*y')
return M
# 对传入的testing data 的单个样本进行分类
def classify(w,b,test_i):
if np.sign(np.dot(w,test_i)+b) == 1:
return 1
else:
return 0 # 测试数据,返回正确率
def test(w,b,test_data):
right_count = 0
for test_i in test_data:
classx = classify(w,b,test_i)
if classx == 1:
right_count += 1
rate = right_count/len(test_data)
return rate if __name__=="__main__":
MA,x= get_train_data()
test_data = get_test_data()
# 定义初始的w,b
w = [0,0]
b = 0
# 初始化最优的正确率
rate0 = 0
# 循环不同的学习率n,寻求最优的学习率,即最终的rate0
# w0,b0为对应的最优参数
for i in np.linspace(0.01,1,100):
n = i
w,b = train(MA,w,b)
# print(w,b)
rate = test(w,b,test_data)
if rate >= rate0:
rate0 = rate
w0 = w
b0 = b
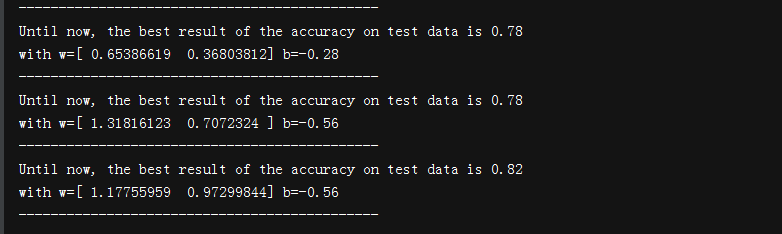
print('Until now, the best result of the accuracy on test data is '+str(rate))
print('with w='+str(w0)+' b='+str(b0))
print('---------------------------------------------')
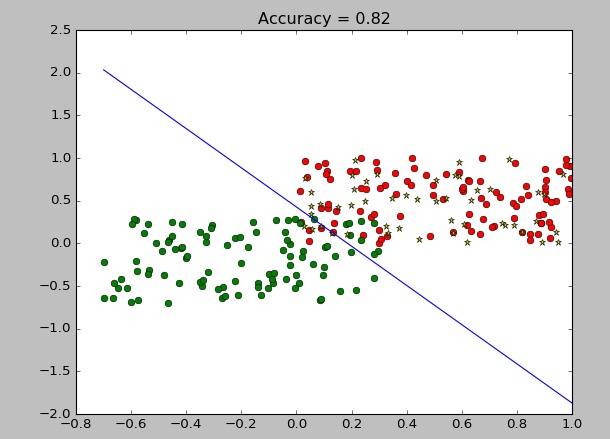
# 在选定最优的学习率后,作图
plot_classify(w0,b0,x,rate0)
plt.show()
输出:
最新文章
- CC_STACKPROTECTOR防内核堆栈溢出补丁分析【转】
- ubuntu下快速制作linux 系统安装盘
- IQueryable和list本地集合区别
- openal-1.13 静态编译(mingw32)
- Retrofit与RXJava整合
- 【BZOJ1968】【AHoi2005】COMMON约数研究
- Codeforces Round #253 (Div. 2) D题
- 虚拟局域网VLAN
- discuz x3插件开发傻瓜图文教程,用demo说话
- php 使用jquery实现ajax
- hdu 4812 D Tree(树的点分治)
- NPC
- VMware虚拟机上网络连接(network type)的三种模式--bridged、host-only、NAT
- 使用runloop阻塞线程的正确写法
- java中Array/List/Map/Object与Json互相转换详解(转载)
- [Linux] PHP程序员玩转Linux系列-telnet轻松使用邮箱
- PAT1004:Counting Leaves
- vue 使用 supermap iclient-classic
- Golang 入门 : 映射(map)
- 虚拟机中ubuntu不能联网问题的解决——NAT方式